Measurement Planning
Work starts with the decisions your team needs to make, so every tracked event and report maps to a real business question.
Prateeksha connects website analytics, business KPIs, dashboard development and automated reporting, so your team can see what happened, understand where the data has limits, and decide what to improve next.

Many businesses have plenty of data and little agreement about what it means. Traffic sits in one tool, ad spend in another, sales in a spreadsheet, and each report tells a slightly different story. Our analytics and reporting services replace that with one measurement system your team has agreed and can trust.
We plan measurement first, verify tracking next, then build dashboards and scheduled reports around the decisions you make. The intended value is practical: less time reconciling numbers and more time acting on them. Results depend on your data sources, consent choices and how the reports are used.
Work starts with the decisions your team needs to make, so every tracked event and report maps to a real business question.
Events are tested end to end and checked for duplicates and gaps before any number is treated as reliable.
Dashboards are built around agreed KPIs, with definitions and data sources shown, instead of a page of every available chart.
Reports arrive on a cadence you choose, with quality checks and plain notes on what the data can and cannot show.
We select tools to fit the work. They are not client logos, partnerships, certifications or endorsements, and they carry no promise of performance.
Consent-aware measurement of site activity, key events and audiences
A managed container for tags and triggers that can change without a code release
Organic query and landing-page data read alongside analytics
Dashboards and scheduled reports built on connected sources

A report only helps when the numbers can be trusted.
Once tracking is reliable, the next step is usually testing what to change. That is where our conversion rate optimization work begins.
Poor measurement has a commercial cost: budget moves on numbers nobody can defend, and real problems stay hidden. These are the issues we diagnose before proposing any work.
Analytics, advertising, store and sales records sit in different places, so nobody sees one version of what happened.
People mean different things by a lead or a conversion, so meetings turn into arguments about the numbers.
A form fires twice or a WhatsApp click is never recorded, and the figures quietly stop being trustworthy.
Someone exports and pastes the same figures every month, which is slow and invites copy errors.
A dashboard is built and glanced at once, because nobody defined what action a given number should trigger.
Reports present campaign credit with more certainty than consent, privacy settings and cross-device use allow.
Seven connected workstreams make up one reporting system, from tracking through to scheduled delivery. This is website and marketing-led analytics scoped to agreed KPIs, not enterprise data engineering.
Traffic, engagement and enquiry activity reported against questions your team has agreed, not every metric a tool can show.
We start with the decisions the data should support, then configure website analytics services around them: traffic sources, landing-page engagement, form submissions, calls, WhatsApp actions and website performance reporting. Search Console data sits beside analytics so organic queries and on-site behaviour can be read together, and SEO analytics reporting stays focused on visibility data. Ranking work itself belongs to our search engine optimization service. Figures reflect consented activity and carry stated limits, so they are a useful baseline rather than a complete count of every visitor.
Gives your team one agreed picture of how visitors find the site and what they do next.
A properly structured GA4 property and tag container, built for your site and documented so your team can maintain it.
Google Analytics 4 setup covers the property, data streams, event naming, key-event marking, internal-traffic filters and audience definitions that match how your site works. Google Tag Manager setup adds a clean container, a documented tag and trigger list, and a preview-and-debug check before anything is published. Consent settings are configured to follow the choices your visitors make. We work from access you grant and own, and you keep full control of the accounts. A short handover note explains how to add or change tags later.
Replaces ad-hoc or inherited tracking with a documented, maintainable measurement foundation.
Form submissions, phone clicks, WhatsApp clicks and campaign tags recorded as distinct, verified events.
Conversion tracking setup starts by defining what counts as a lead or a sale for your business. We then implement each event, test it end to end, and check for duplicates and gaps before the numbers inform anything. Campaign tagging follows one consistent convention so spend and traffic can be matched across channels. Attribution is directional: browser privacy settings, ad blockers, cross-device behaviour and consent choices all limit what can be observed. Once tracking is reliable, our conversion rate optimization service can use it to test improvements.
Makes enquiry and sales events trustworthy enough to compare channels and pages.
Sales, marketing and operational measures from accessible data sources, brought into one agreed view.
Business analytics solutions begin with a short KPI workshop: which measures your leadership actually reviews, how each is defined, and where its data lives. We then connect the sources we can access, such as analytics, advertising platforms, spreadsheets and exports you provide, and reconcile definitions so two reports do not disagree. This is website and marketing-led reporting scoped to agreed KPIs. It is not enterprise data engineering, and predictive modelling is outside this service. Channel decisions that follow from the numbers sit with our digital marketing work.
Puts the measures leadership cares about in one place, with definitions everyone shares.
Clear dashboards built around the KPIs you agreed, designed for the person who will read them every week.
We build Looker Studio dashboards that answer the questions set in the planning stage, rather than filling pages with every available chart. Layout follows the reader: a summary view for leadership, with supporting pages for channels, pages and enquiries. Connectors come from the sources you own, and each chart is labelled with its definition and data source. Data freshness depends on source connectors, permissions, quotas and refresh schedules, so near-real-time or source-dependent updates are described plainly, never as instant. Looker Studio is a Google product used for this work; no partnership or certification is implied.
Turns agreed KPIs into a dashboard your team can read without a walkthrough.
Product, cart and purchase events plus sales reporting, so store and enquiry performance can be reviewed together.
Ecommerce analytics depends on events configured correctly: product views, add-to-cart, checkout steps and purchases. We implement and validate them, then report revenue and order data next to traffic and campaign sources. For enquiry-led sales teams, sales performance reporting can bring lead sources and recorded outcomes from your CRM or spreadsheets into one view. Revenue can be attributed to campaigns only as far as the data allows, and results depend on demand, price, margin, stock and competition. Store builds and platform work sit with our ecommerce service.
Connects marketing activity to orders or recorded sales, with its limits stated.
Recurring dashboards and report delivery, with quality checks so automation does not repeat a mistake.
Automated reporting solutions remove repetitive manual work: scheduled dashboard refreshes, recurring weekly or monthly report delivery, and a short written commentary where the connected sources support it. We build in quality checks for broken connectors, duplicate events and sudden drops, because an automated error simply arrives faster. Cadence is agreed with you, and each report states its data sources and limits. Automation depends on connector access, permissions and platform changes, so we review the setup on a schedule instead of treating it as finished once delivered.
Keeps reporting regular and consistent without relying on someone remembering to export data.
A reporting partner is judged on method more than slogans. Ours is to define measures first, test tracking before reporting on it, and hand over something your team can maintain.
We agree KPIs and definitions before building a chart, so the dashboard answers set questions instead of decorating raw data.
The same team configures GA4, Tag Manager and dashboards and explains what the numbers mean, including where the data is thin.
We also build and maintain websites, search work and stores, so reporting reflects how those pages and campaigns actually work.
Events are tested before sign-off, and a written note records definitions, sources and how to change a tag later.
Connectors use accounts you own with least-privilege access, and are reviewed on a schedule because platform changes can break them.

The Process
Timing depends on the number of sources, the state of existing tracking and how quickly access and reviews happen, so the written scope confirms the schedule. Every stage ends with an output you can see and a checkpoint you approve.
What should the data help you decide?
We run a short workshop on your goals, decisions and KPI definitions. Output: a written KPI and event definition list. Checkpoint: you approve the definitions before any tracking is built.
What is tracked today, and is it reliable?
We review existing GA4, Tag Manager, Search Console and other sources you grant access to. Output: an audit of gaps, duplicates and risks. Checkpoint: you confirm which fixes and sources are in scope.
How does the data get captured and connected?
We configure or correct tags, events and connectors against the approved definitions. Output: a tested implementation with preview and debug notes. Checkpoint: the events pass testing before reporting begins.
What will your team actually read?
We design dashboards and report layouts around the agreed KPIs, labelled with definitions and sources. Output: draft dashboards and a sample report. Checkpoint: your team reviews and signs off the layout.
Does it keep working and keep improving?
We check figures against source data, schedule refreshes and delivery, and plan periodic reviews. Output: automated reports and a data-limits note. Checkpoint: you approve the cadence and the review dates.
The first conversation reviews your business questions, data sources, account access, tracking quality, KPI definitions and how often you want to see reports.
You receive a written scope before you commit to anything. Prefer a formal estimate? Request a quote.
Start with a consultationShare general contact details and a short description of your current tracking. Please do not submit passwords, personal customer exports or sensitive credentials through this form.
Selected Work
These are general website projects showing our structure, page layout and enquiry-path work. They are not analytics case studies, and we do not present them as evidence of analytics, traffic or sales outcomes.
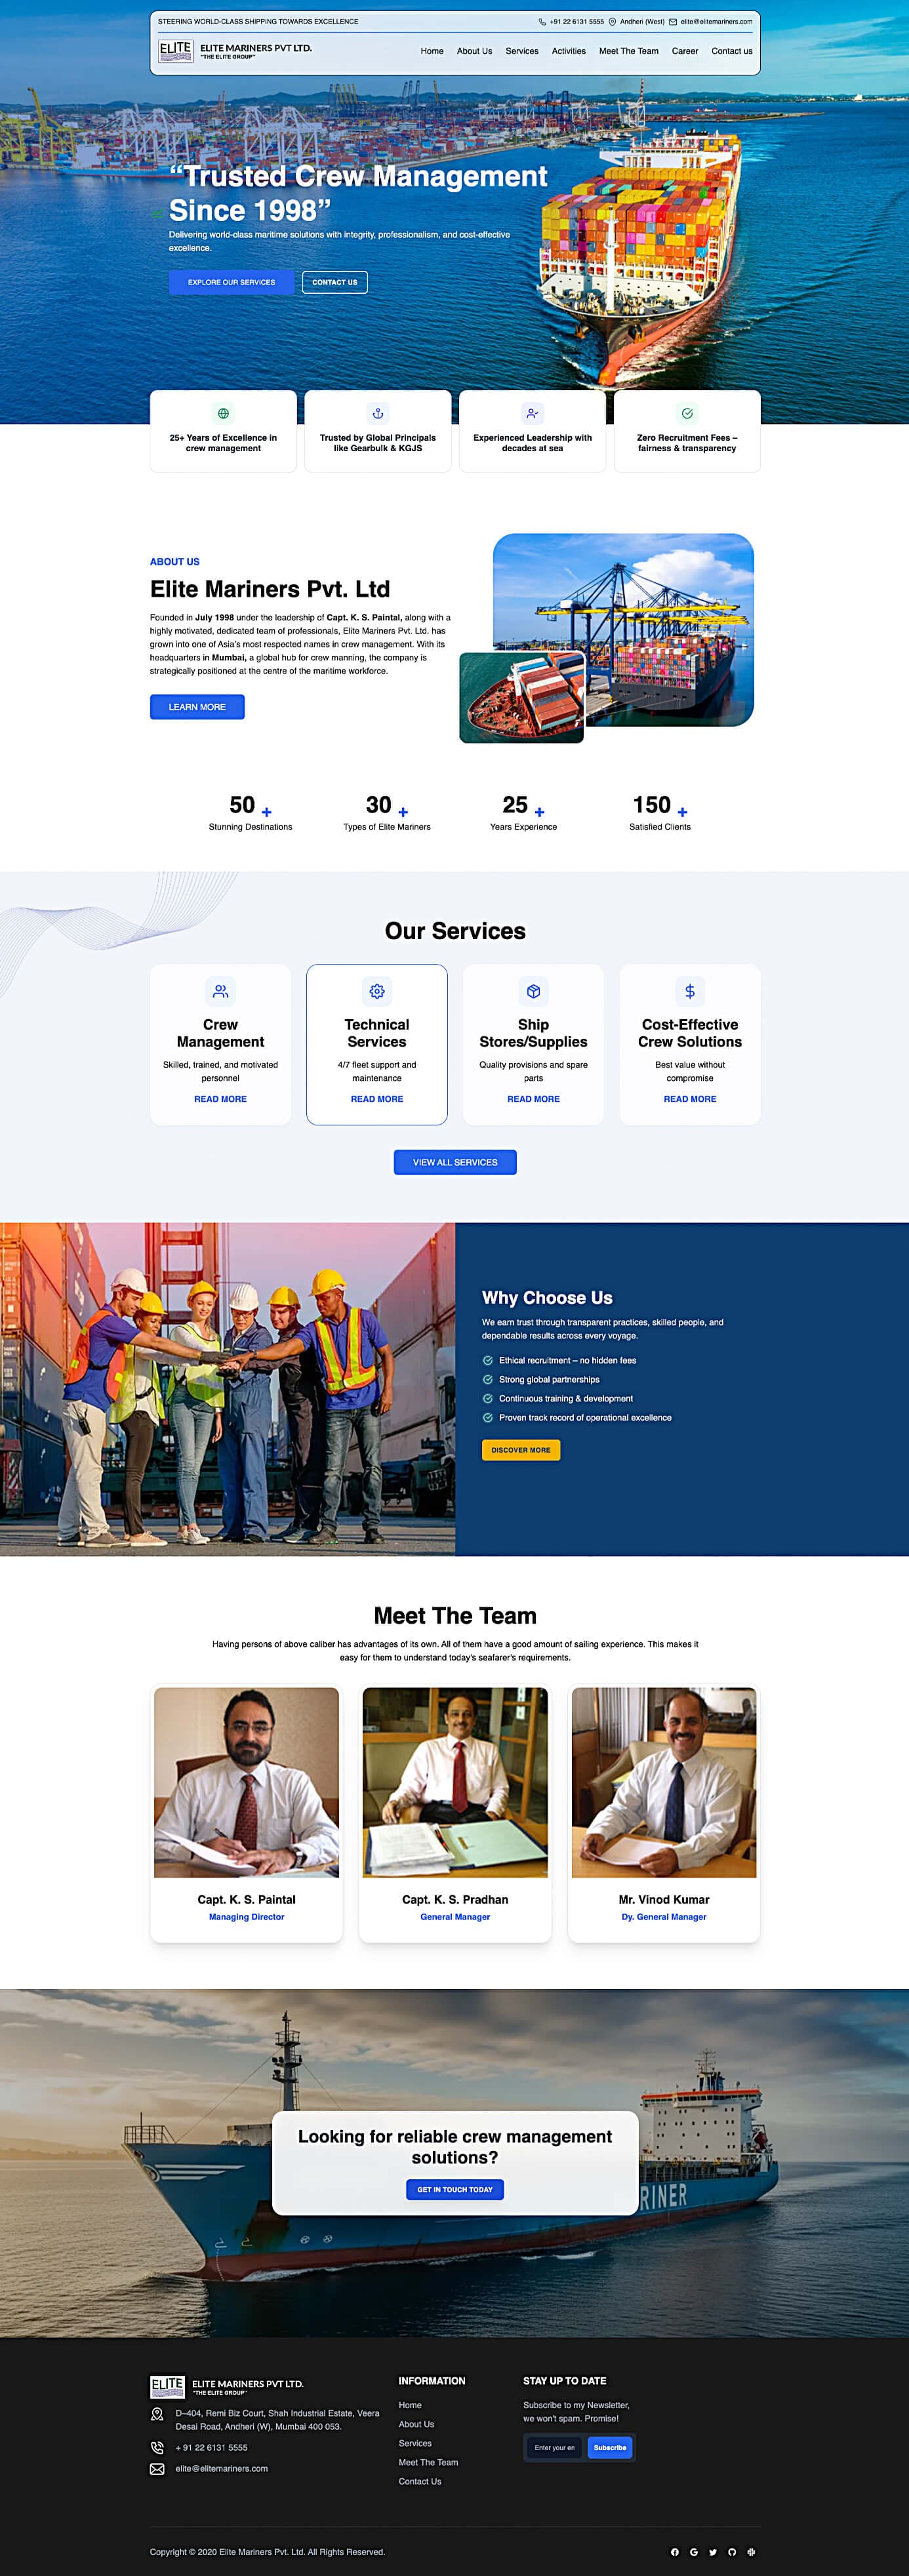
Corporate website architecture and service presentation built to explain maritime crew management, technical services and direct enquiry channels clearly.
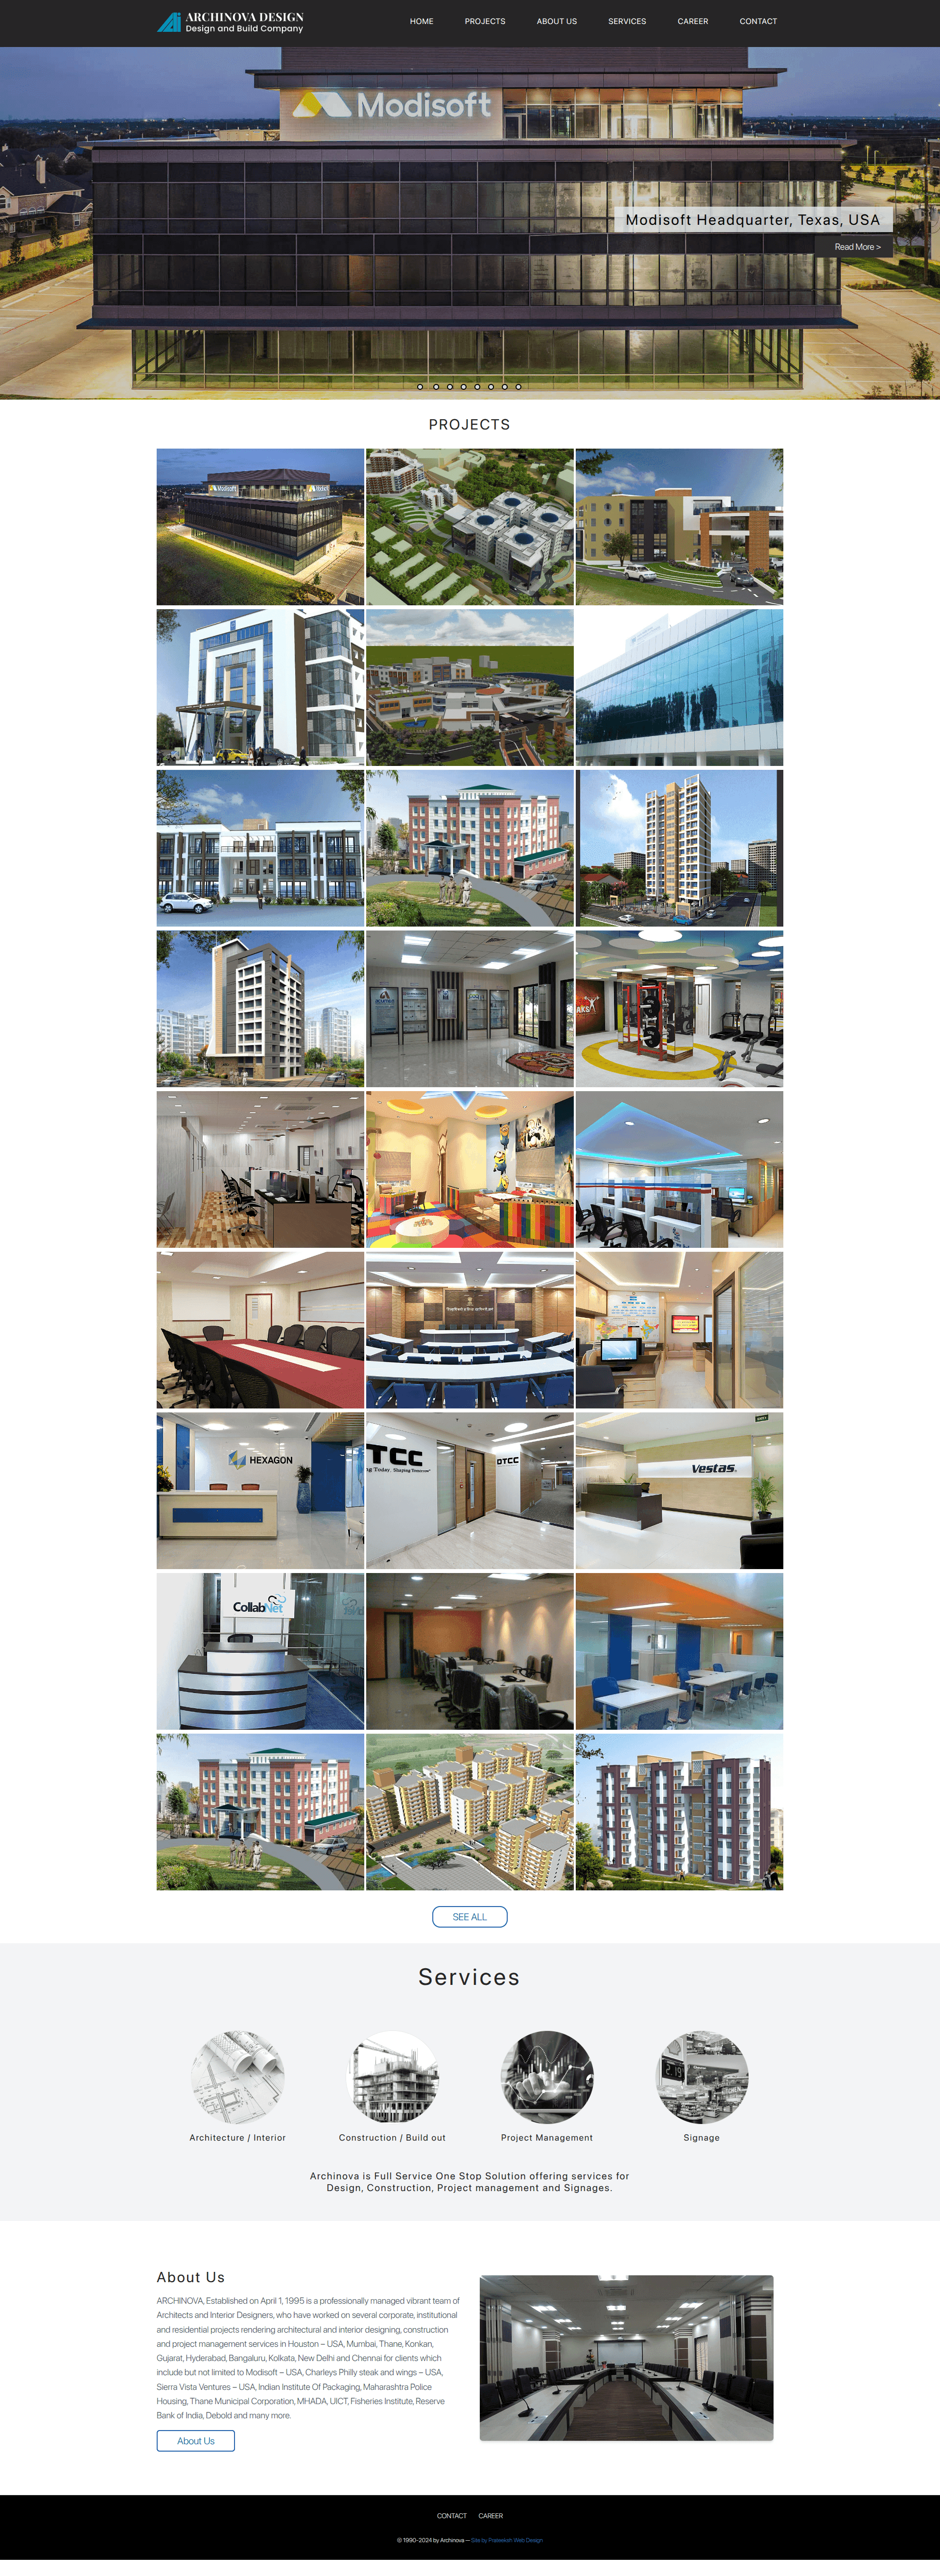
Structured portfolio and service showcase for an architecture practice, organising commercial and residential work with clear consultation paths.
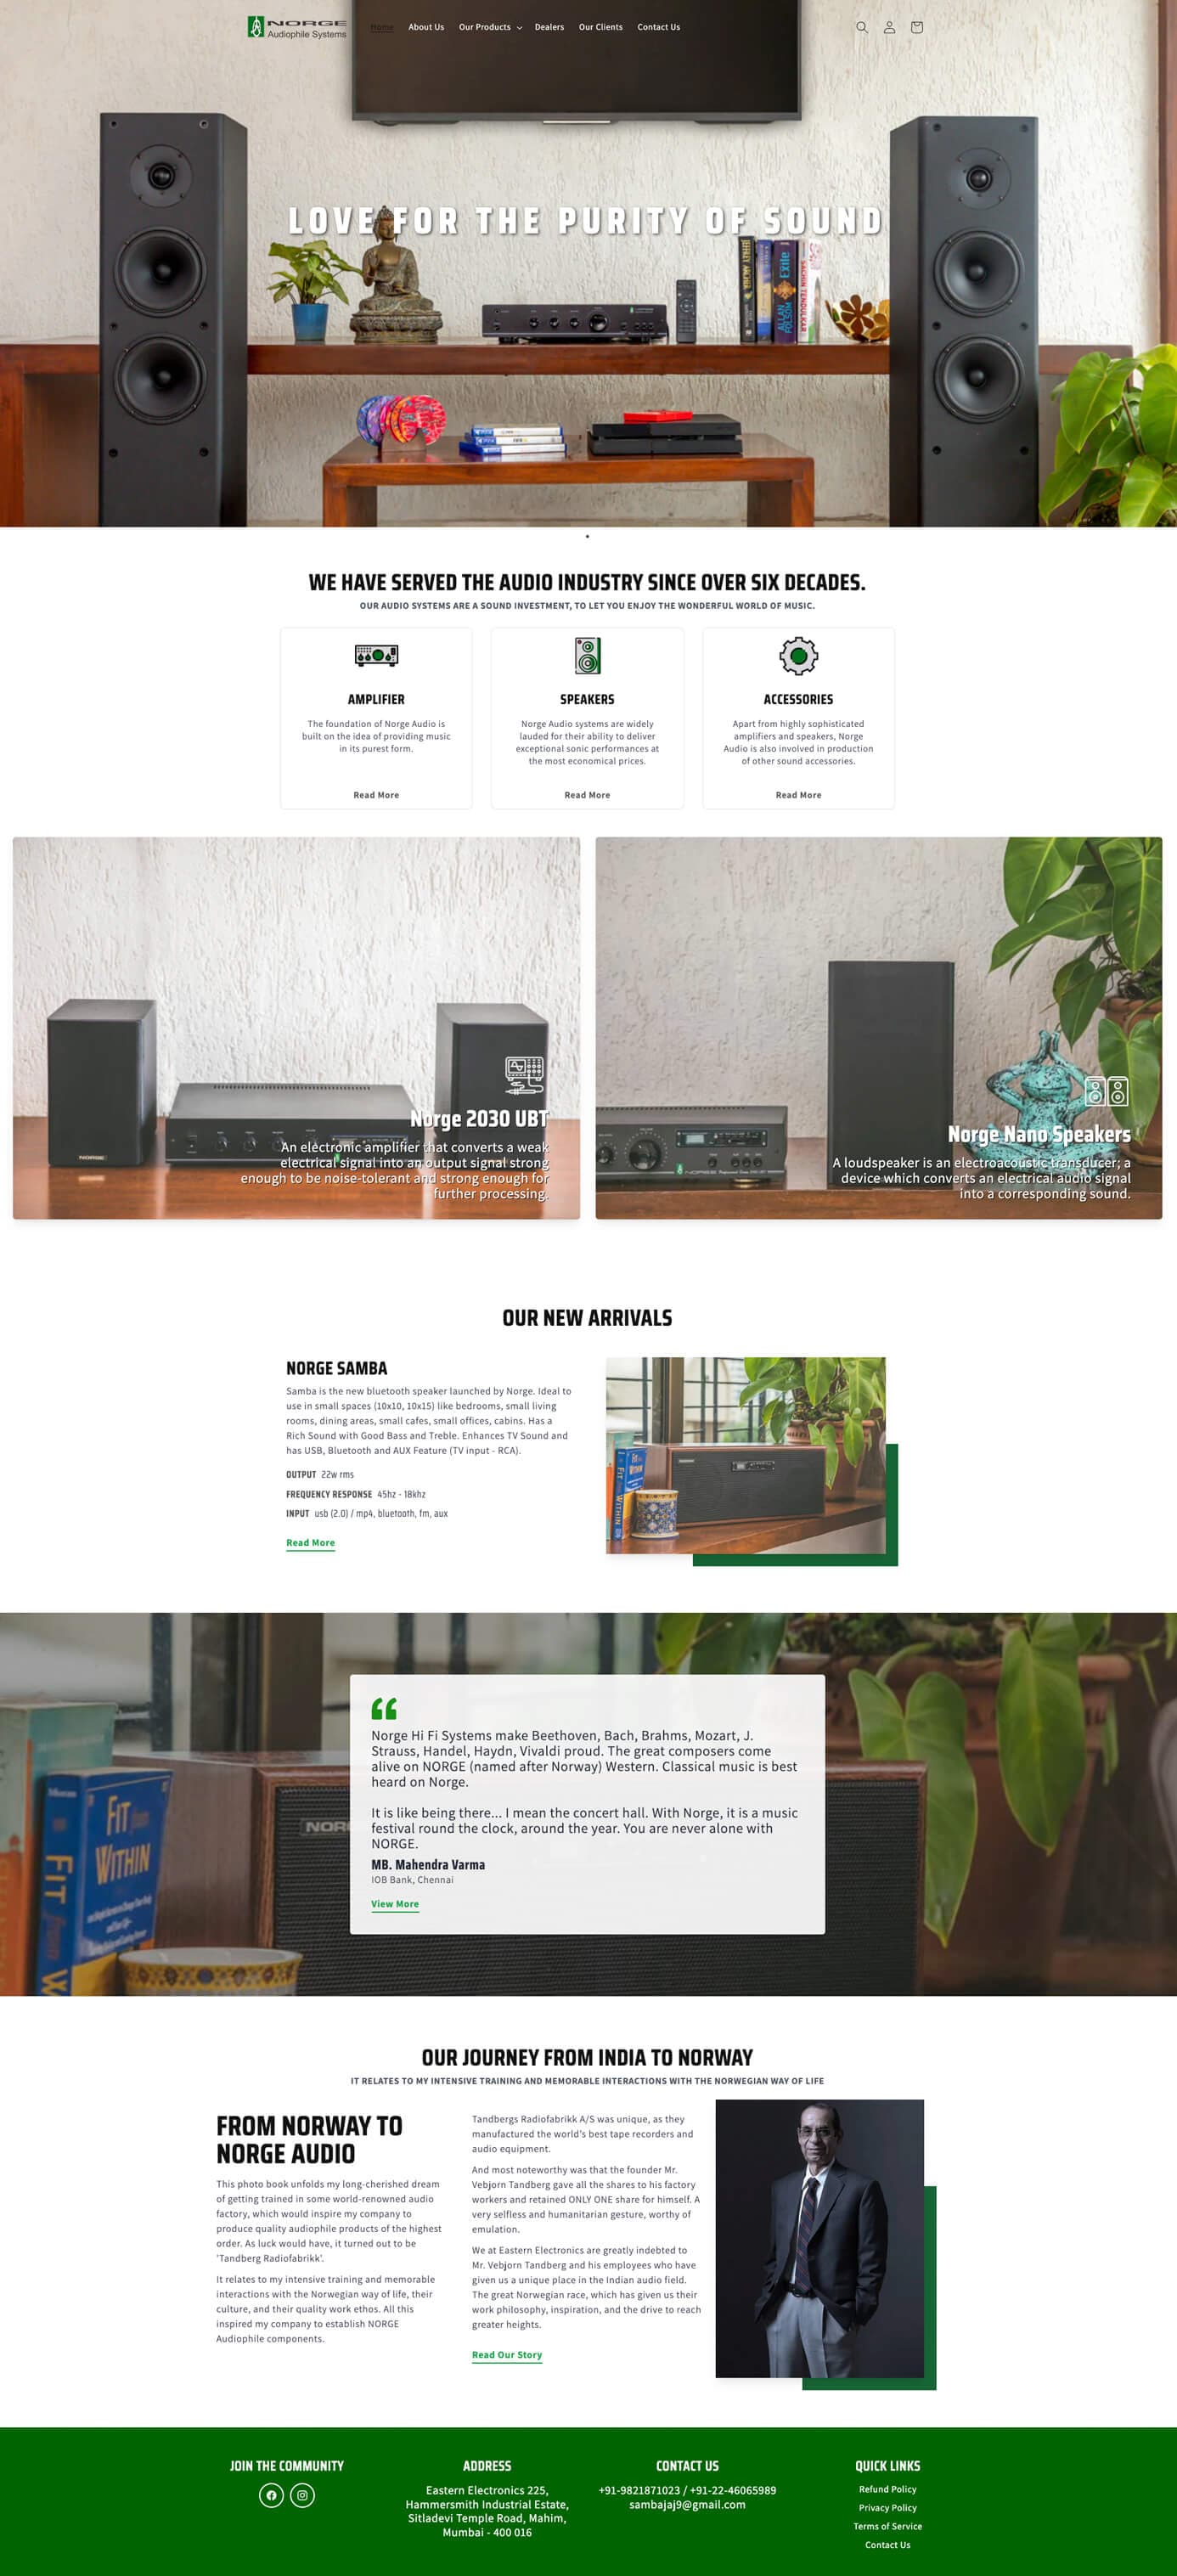
Product-focused website presenting an audio brand’s range and details in a clean, structured layout with direct contact routes.
FAQs
Straight answers on scope, data freshness, attribution limits and access.
Not sure where to start? Share your goals and we will recommend a plan, in writing.
Measurement planning, Google Analytics 4 and Google Tag Manager setup, conversion tracking, Search Console integration, business KPI analytics, Looker Studio dashboards, ecommerce and sales reporting, and scheduled reports. The scope is confirmed in writing after we review your questions, data sources and current tracking, so you only pay for the workstreams you need.
A GA4 property and data streams, an agreed event structure, key events for the actions that matter to you, internal-traffic filters, audience definitions and consent-aware settings. We test the result before sign-off and write a short handover note. You keep ownership of the account throughout.
A container with a documented list of tags and triggers, preview and debug checks, and a published version you can roll back. It lets tags change without a code release each time. We work from access you grant, scoped to what the job needs.
Yes. We build Looker Studio dashboards around the KPIs agreed at the start, using connectors to sources you own, and we label each chart with its definition and source. Looker Studio is a Google product we use for this work. That use implies no partnership or certification.
Website analytics, Search Console, advertising platform data, ecommerce orders, and sales or lead records from a CRM, spreadsheet or export you provide. A source can be included only where we have lawful, scoped access to it and a connector or file route exists. Each source is confirmed before the dashboard is designed.
Yes. We can schedule dashboard refreshes and recurring report delivery, with a short written commentary where the connected sources support it. We add quality checks for broken connectors and duplicate events, and review the setup on a schedule, because platform changes can interrupt automation.
Yes. We validate product, cart and purchase events, then report revenue and orders beside traffic and campaign sources. For enquiry-led businesses we can bring lead sources and recorded outcomes into one view. Results depend on demand, price, margin, stock and competition, so reporting shows what happened without promising a change.
Not in the strict sense. Freshness depends on each source, connector, permission, quota and refresh schedule, and Google Analytics itself has processing delays. Requests for a real time analytics dashboard are delivered as near-real-time or source-dependent reporting where the sources support it, and each dashboard states how often it updates.
Directionally useful, never complete. Browser privacy settings, ad blockers, cross-device behaviour, consent choices and platform reporting rules all limit what can be observed. We apply consistent campaign tagging and describe the limits next to every attribution figure, so no report presents more certainty than the data supports.
Tracking is configured to follow the choices your visitors make, so some sessions have partial or no data by design. That is expected behaviour, not a fault. Reports describe consented visitor and enquiry activity, and we do not claim to capture data that privacy tools are built to withhold.
View or edit access to the relevant accounts, such as Google Analytics, Tag Manager, Search Console and any advertising or store platforms, granted by an owner of those accounts. We ask for the least access the job needs, and you keep ownership. Please do not send passwords or customer exports through the enquiry form.
It varies with the number of sources, the state of existing tracking, how quickly access is granted and how fast your team can review. We confirm the schedule in the written scope rather than quoting a fixed time up front, and each stage ends with a checkpoint you approve.
Looking at the wider picture? Website growth strategy and ecommerce growth treat measurement as one part of a larger system.
Locations
We proudly serve clients in major cities worldwide, delivering exceptional web design, development, and digital marketing services.